Tokopedia Lite
Homepage Optimization
Six targeted optimizations that reduced transfer size by 31.4% and eliminated layout shifts
Total Transfer Size
31.4%
10.5 MB → 7.2 MB
Hydration Time
36.1%
1.39s → 885ms
Left Carousel Chunk Size
83.7%
3.8 MB → 619 kB
Time to Interactive (TTI)
8.77%
11.86s → 10.82s
Chosen Address
526ms hydration tax → 0ms (loads after hydration)
Problem
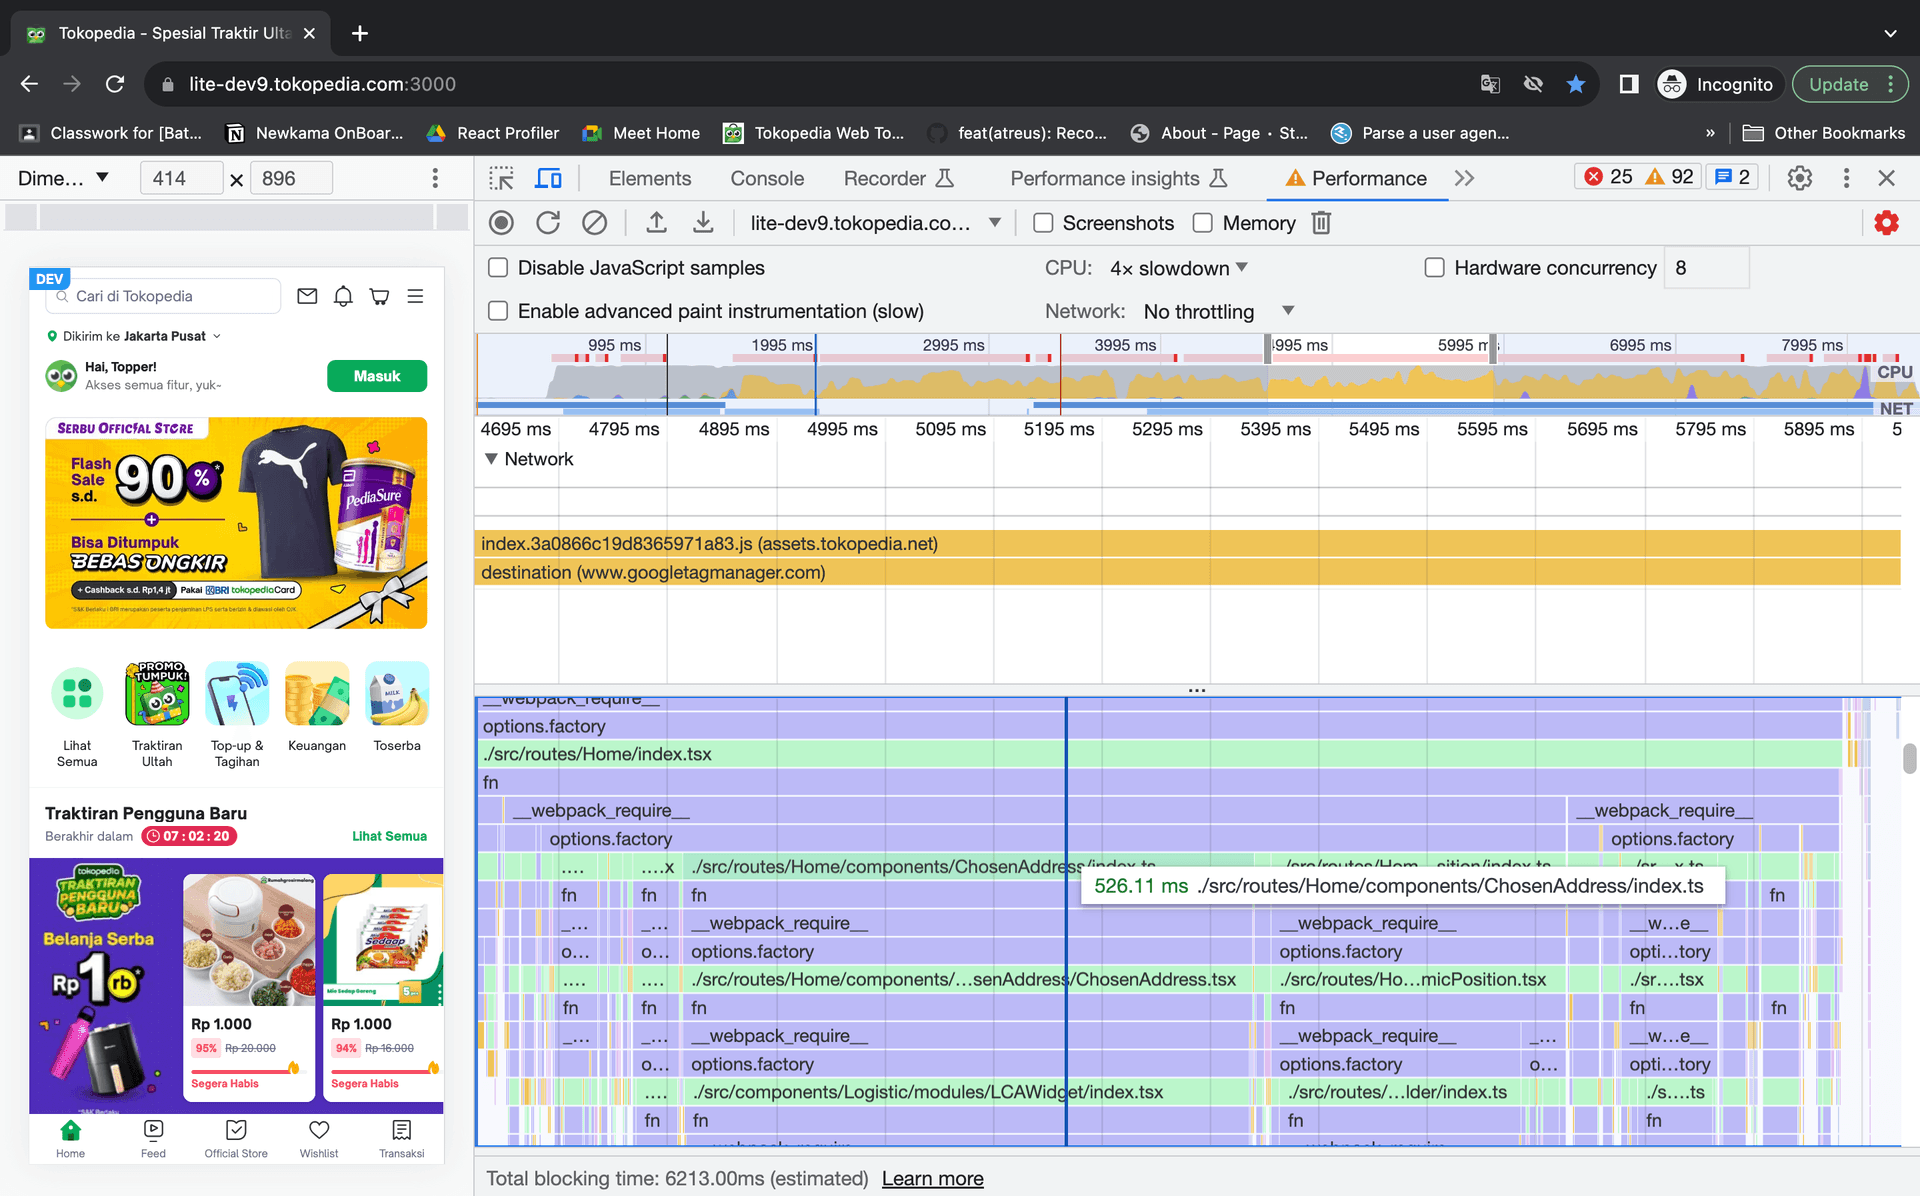
Before: Chosen Address widget was the largest hydration contributor (526ms of 1.39s total)
- •Chosen Address widget was SSR-enabled but blocked hydration for 526ms
- •Component not visible above-the-fold but added to critical hydration path
- •1.39s total hydration time with 38% spent on this single component
Solution
import loadable from '@loadable/component';

const ChosenAddress = loadable(
  () => import('./ChosenAddress'),
  { ssr: false },  // ← Skip SSR, load after hydration
);

// Usage: component loads asynchronously after page is interactive
<ChosenAddress />- •React.lazy doesn't support SSR — throws 'not supported for server-side rendering'
- •@loadable/component extracts chunk info for server, supports ssr: false option
- •ssr: false removes component from hydration path entirely
- •Component loads asynchronously after page becomes interactive
Output
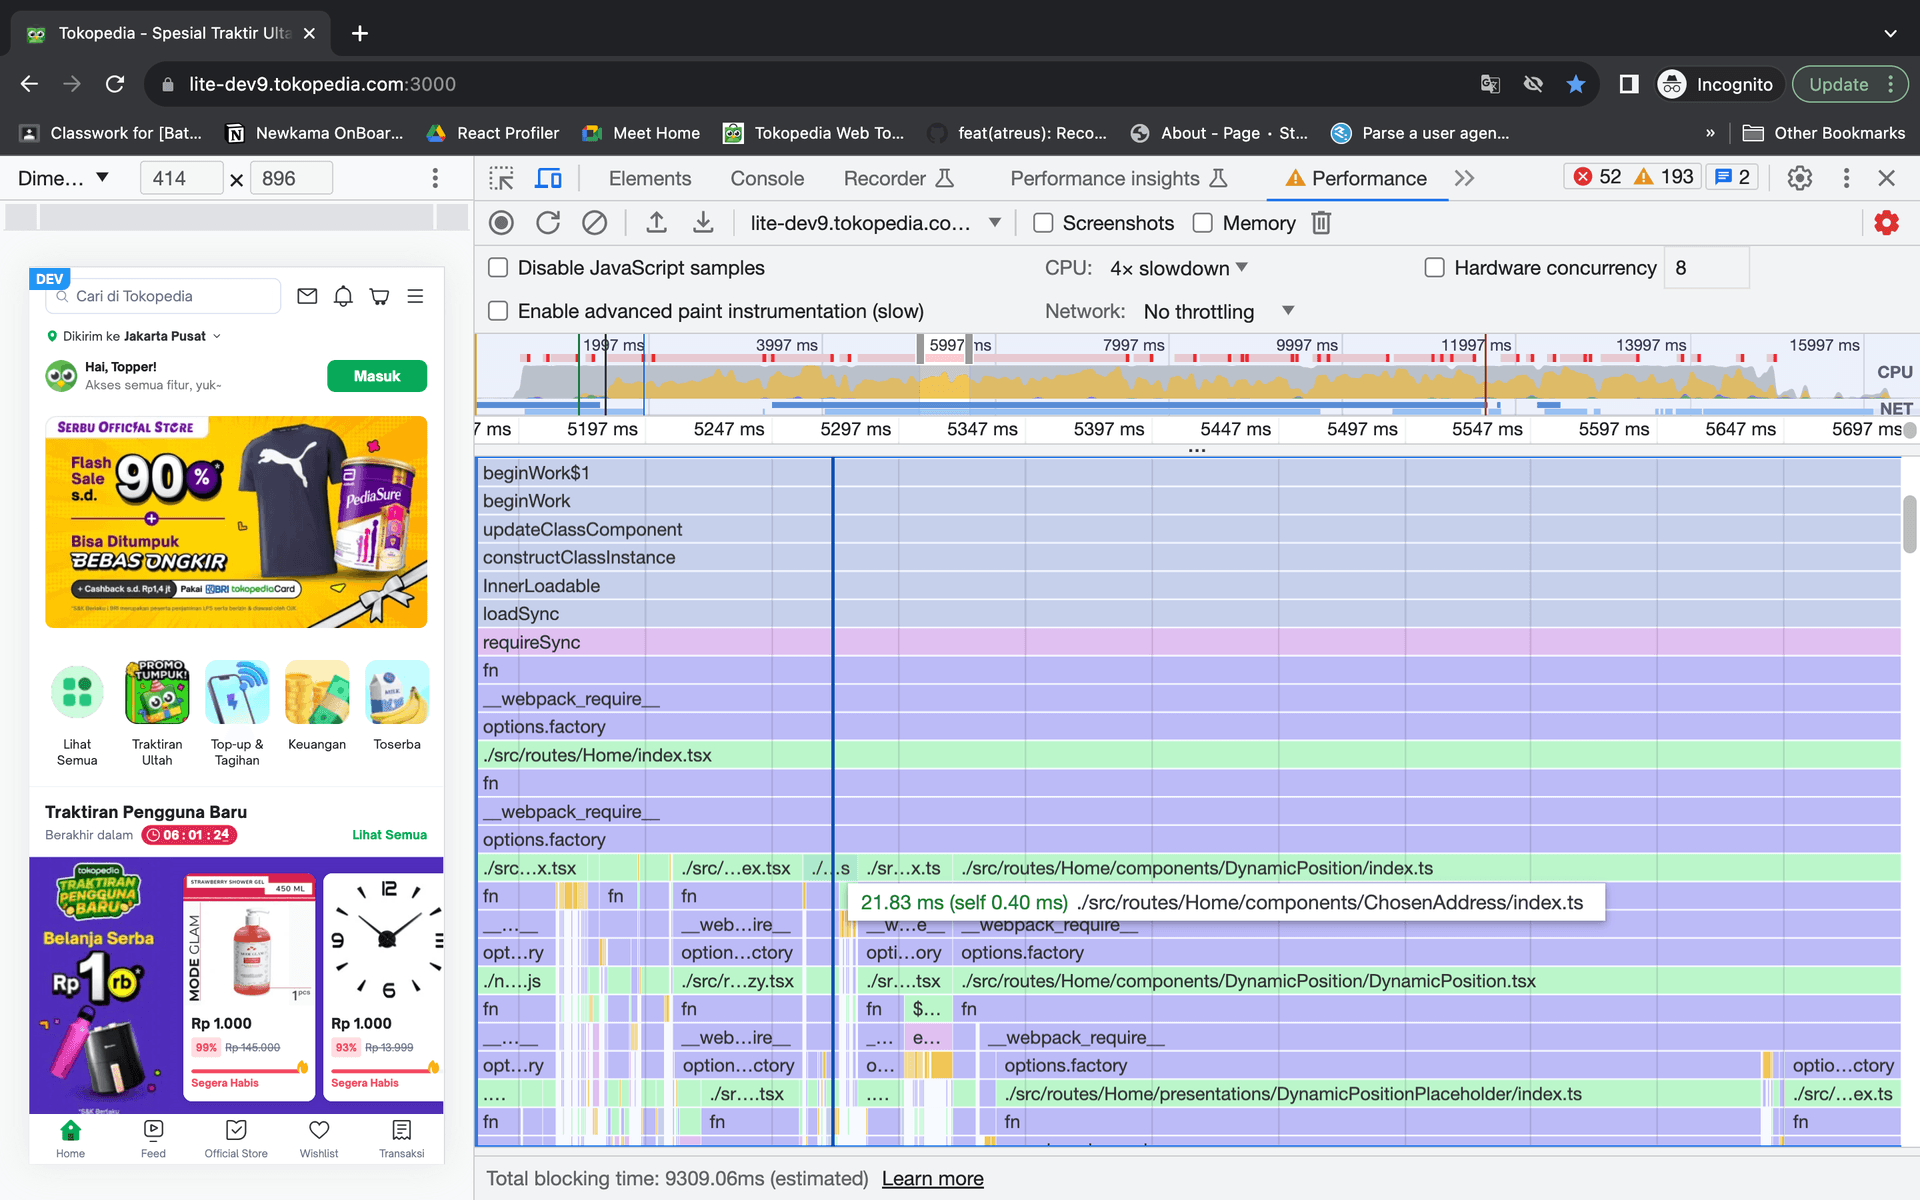
After: Hydration time reduced by 36.1% (from 1.39s to 885ms)
| Metric | Before | After | Improvement |
|---|---|---|---|
| Hydration Time | 1.39s | 885ms | 36.1% reduction |
| ChosenAddress Tax | 526ms | 0ms | 100% eliminated |
Left Carousel
3.8MB bundle → 619KB (83.7% reduction)
Problem
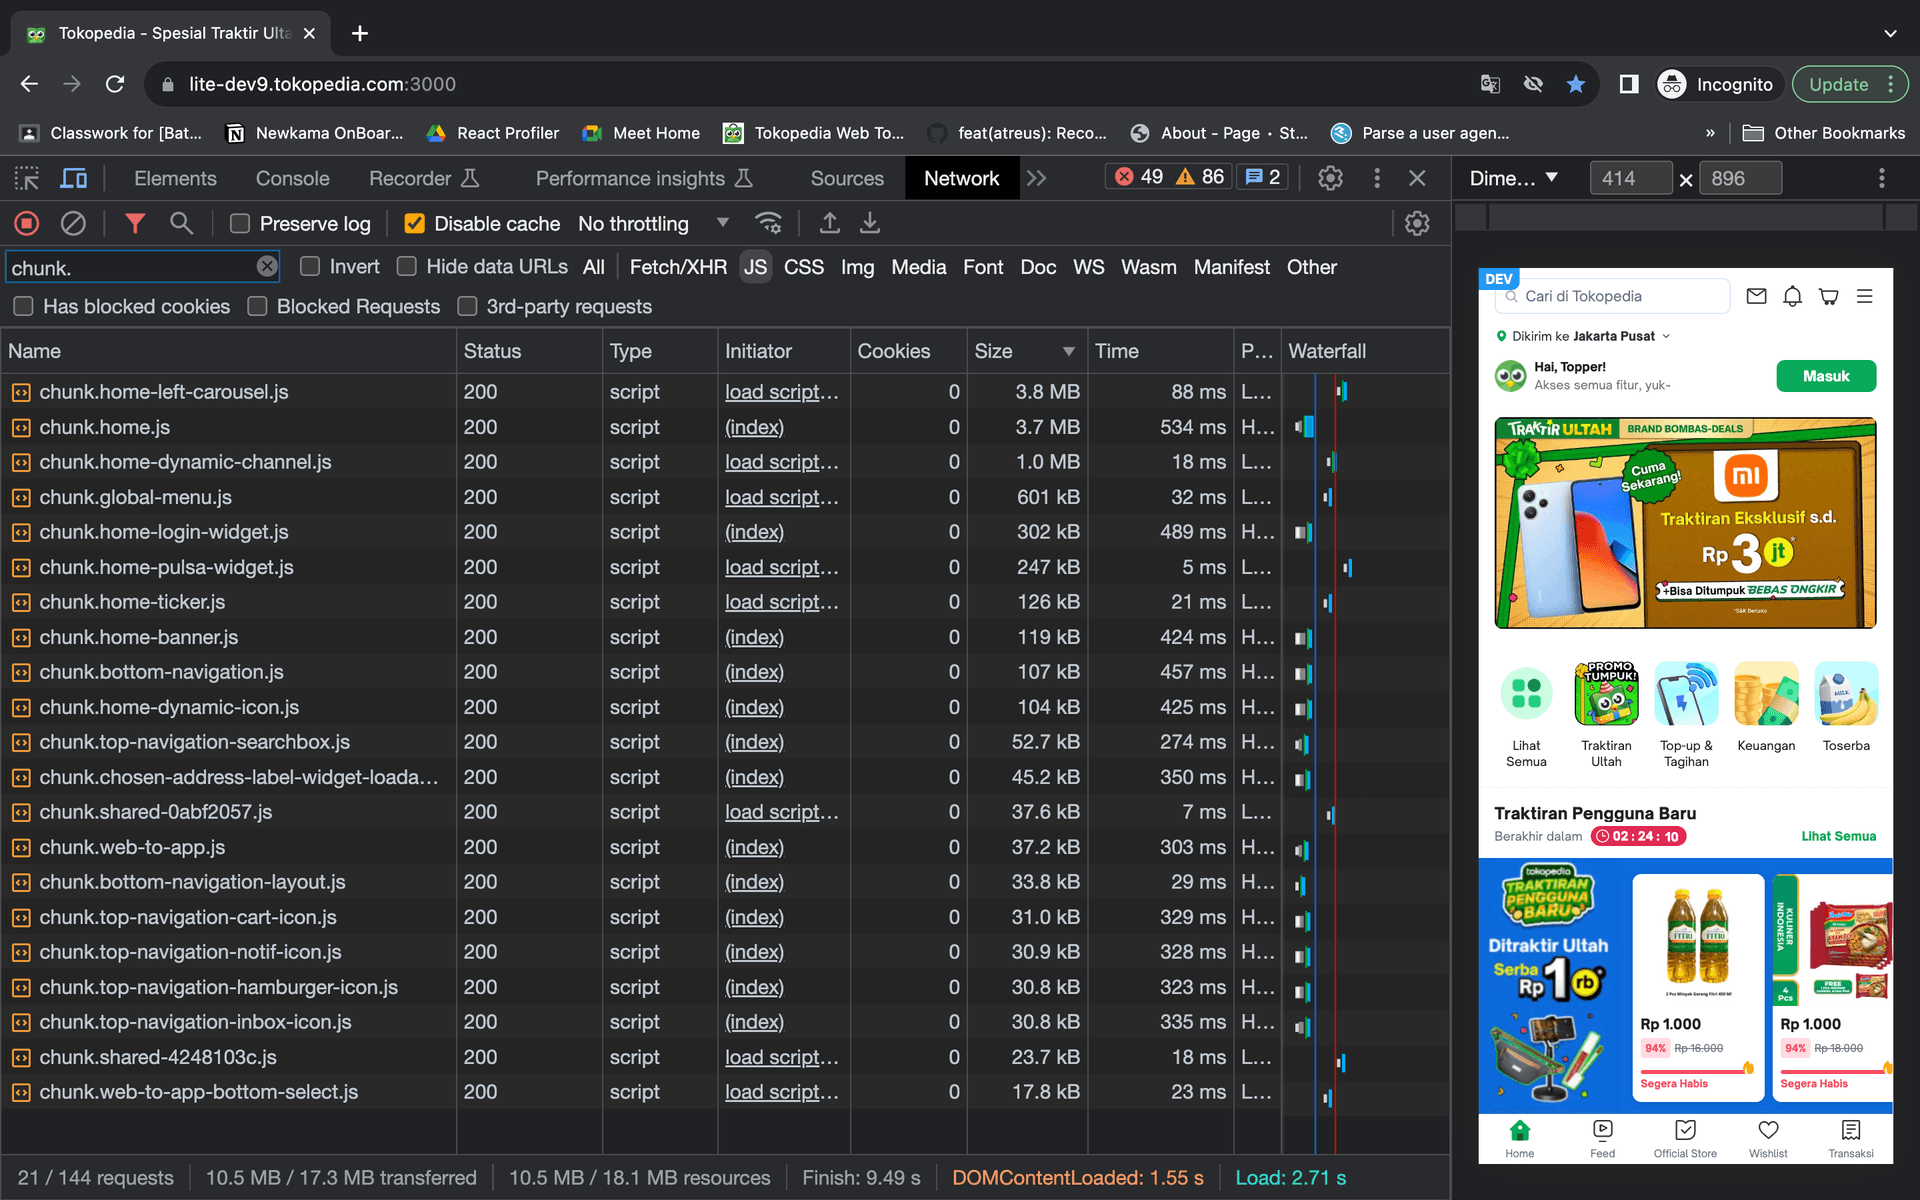
Bundle Analysis: Left Carousel was 3.8MB including unused Tokonow components
- •Inline conditional rendered both ProductCardV3 and ProductCardTokonow
- •Webpack bundled BOTH components regardless of runtime condition
- •3.2MB of dead code — Tokonow variant rarely used in practice
Solution
// BEFORE: Both components bundled
const Product = ({ isTokonow, ...rest }) => {
  const Card = isTokonow
    ? ProductCardTokonow  // ← Bundled
    : ProductCardV3;      // ← Bundled
  return <Card {...rest} />;
};

// AFTER: Consumer provides component
const LeftCarousel = ({ children }) => (
  <Container>{children}</Container>
);

// Usage: only needed component is imported
<LeftCarousel>
  {products.map(p => (
    <ProductCardV3 key={p.id} {...p} />
  ))}
</LeftCarousel>- •Render props pattern shifts component selection to consumer
- •Webpack can now trace actual imports and eliminate dead code
- •Only ProductCardV3 bundled — ProductCardTokonow excluded entirely
- •Component API change with identical visual output
Output
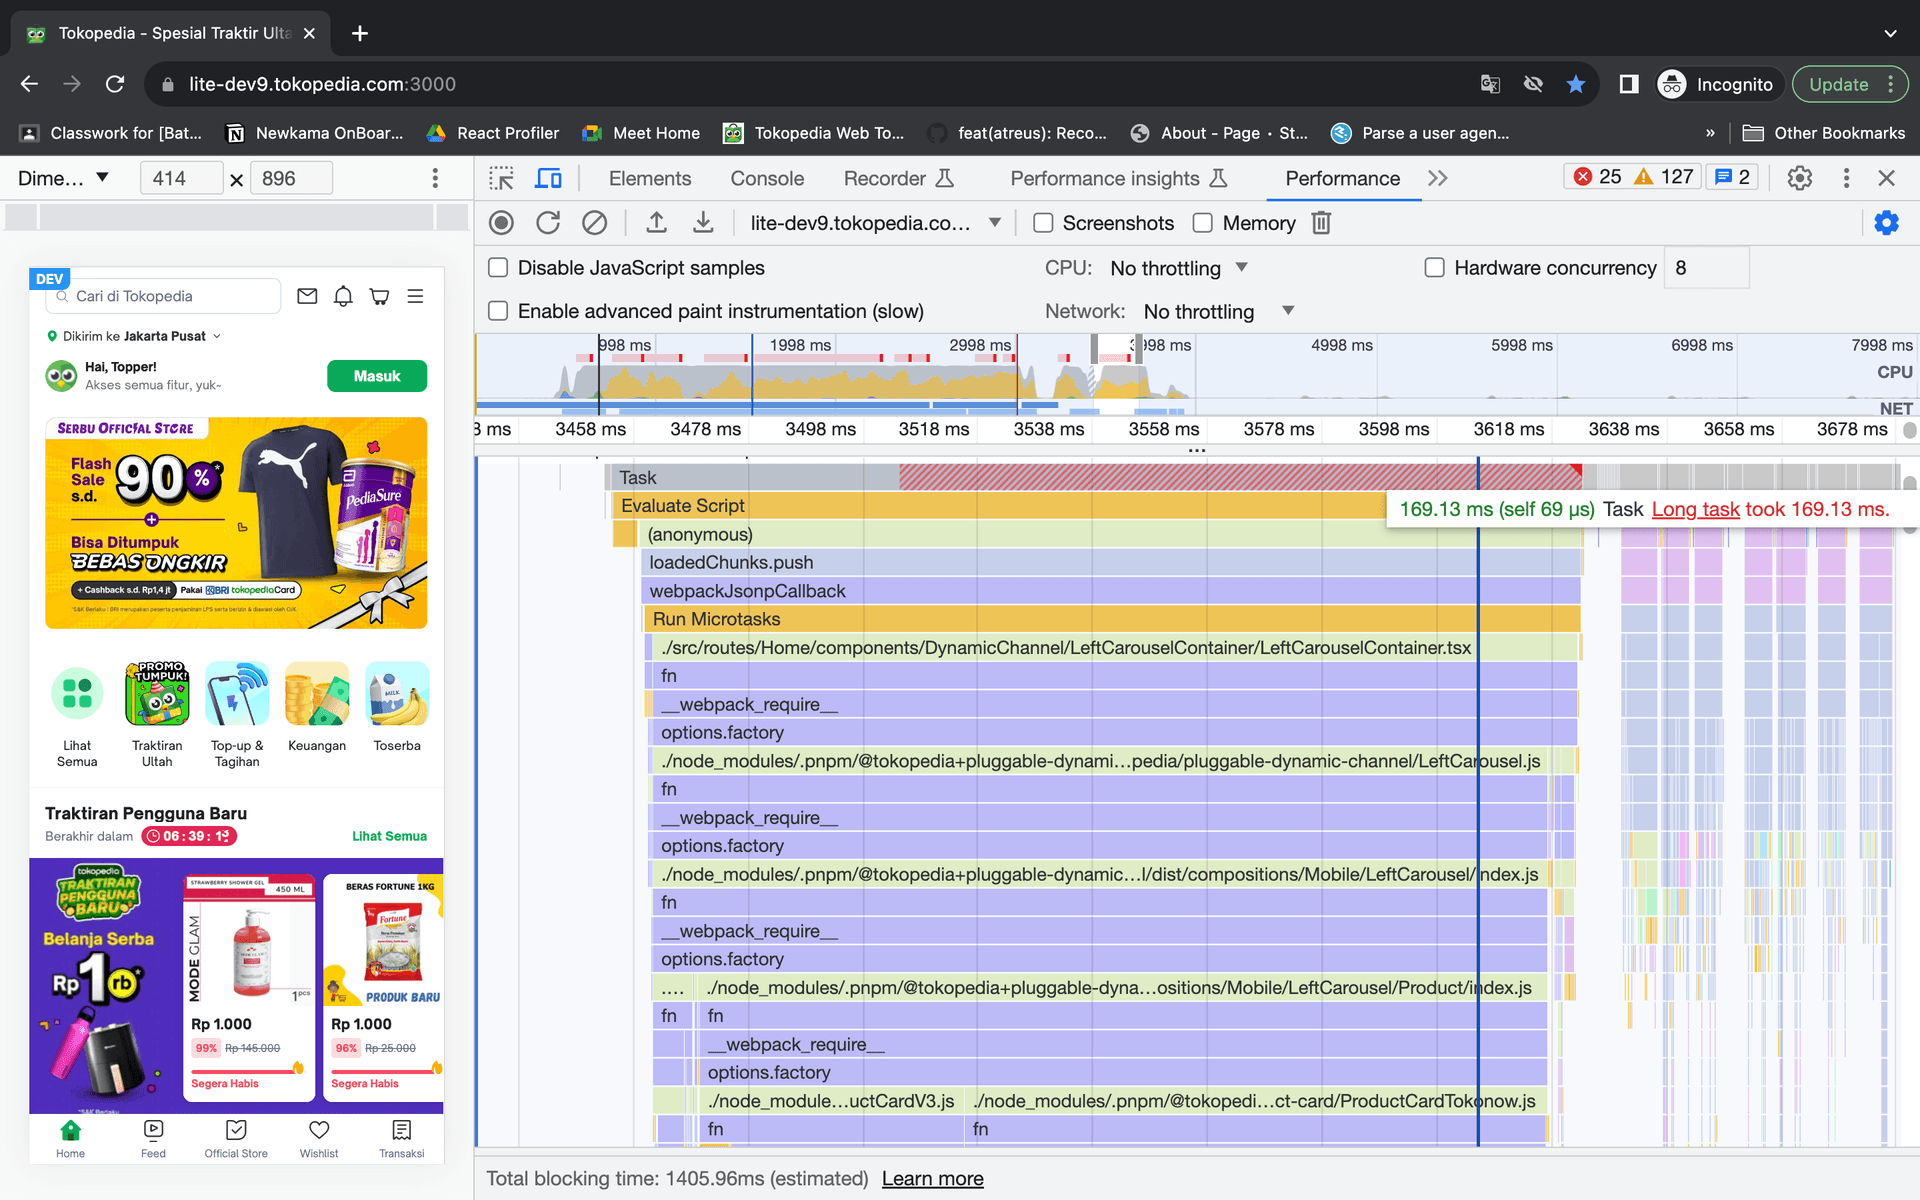
Root Cause: Inline conditional rendering caused both product card variants to be bundled
| Metric | Before | After | Improvement |
|---|---|---|---|
| Chunk Size | 3.8 MB | 619 kB | 83.7% reduction |
| Dead Code | ~3.2 MB | 0 MB | 100% eliminated |
Dynamic Icon
All icons render on load → Only visible icons render
Problem
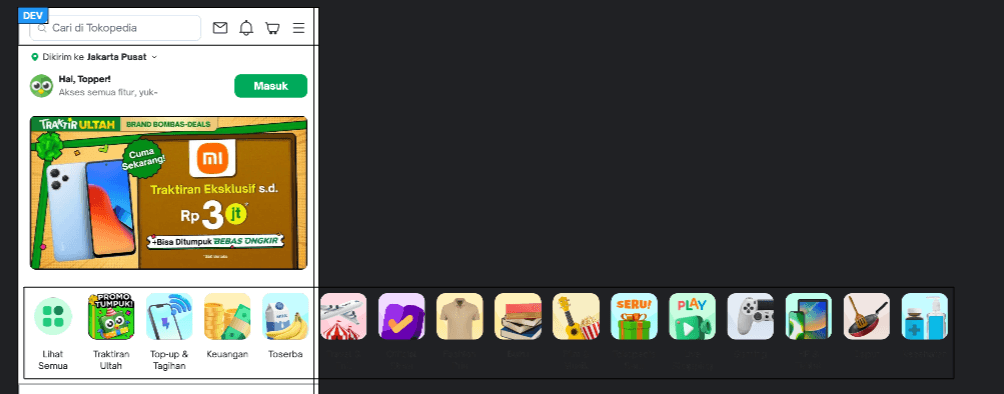
Issue: All icons rendered on first load, creating unnecessary DOM elements
- •Dynamic Icon component rendered all 50+ icons immediately on mount
- •Created excessive DOM nodes before user could see them
- •Unnecessary paint workload during critical initial render
Solution
const LazyFrame = ({ children, enabled, placeholder }) => {
  const [mounted, setMounted] = useState(!enabled);
  const ref = useRef(null);

  useEffect(() => {
    const observer = new IntersectionObserver(
      (entries) => entries.forEach((entry) => {
        if (entry.isIntersecting) {
          startTransition(() => setMounted(true));
          observer.disconnect();
        }
      }),
      { threshold: 0.1 }
    );

    if (ref.current) observer.observe(ref.current);
    return () => observer.disconnect();
  }, [enabled]);

  return (
    <div ref={ref}>
      {mounted ? children : placeholder}
    </div>
  );
};- •Intersection Observer defers rendering until element enters viewport
- •startTransition marks update as non-urgent — won't block interactions
- •Placeholder maintains layout stability while deferring actual render
- •Only 3-4 visible icons rendered initially vs 50+
Output
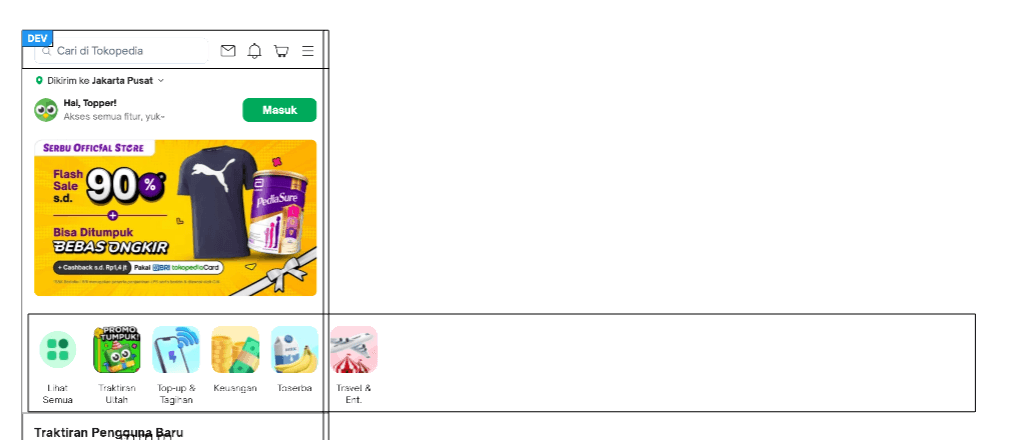
Solution: Render blank divs for offscreen icons, reducing paint workload
| Metric | Before | After | Improvement |
|---|---|---|---|
| Initial DOM Nodes | 50+ | 3-4 | ~92% reduction |
| Paint Workload | High | Minimal | Deferred to viewport |
Home Banner
6 A/B variants + unused hooks → Simple div
Problem
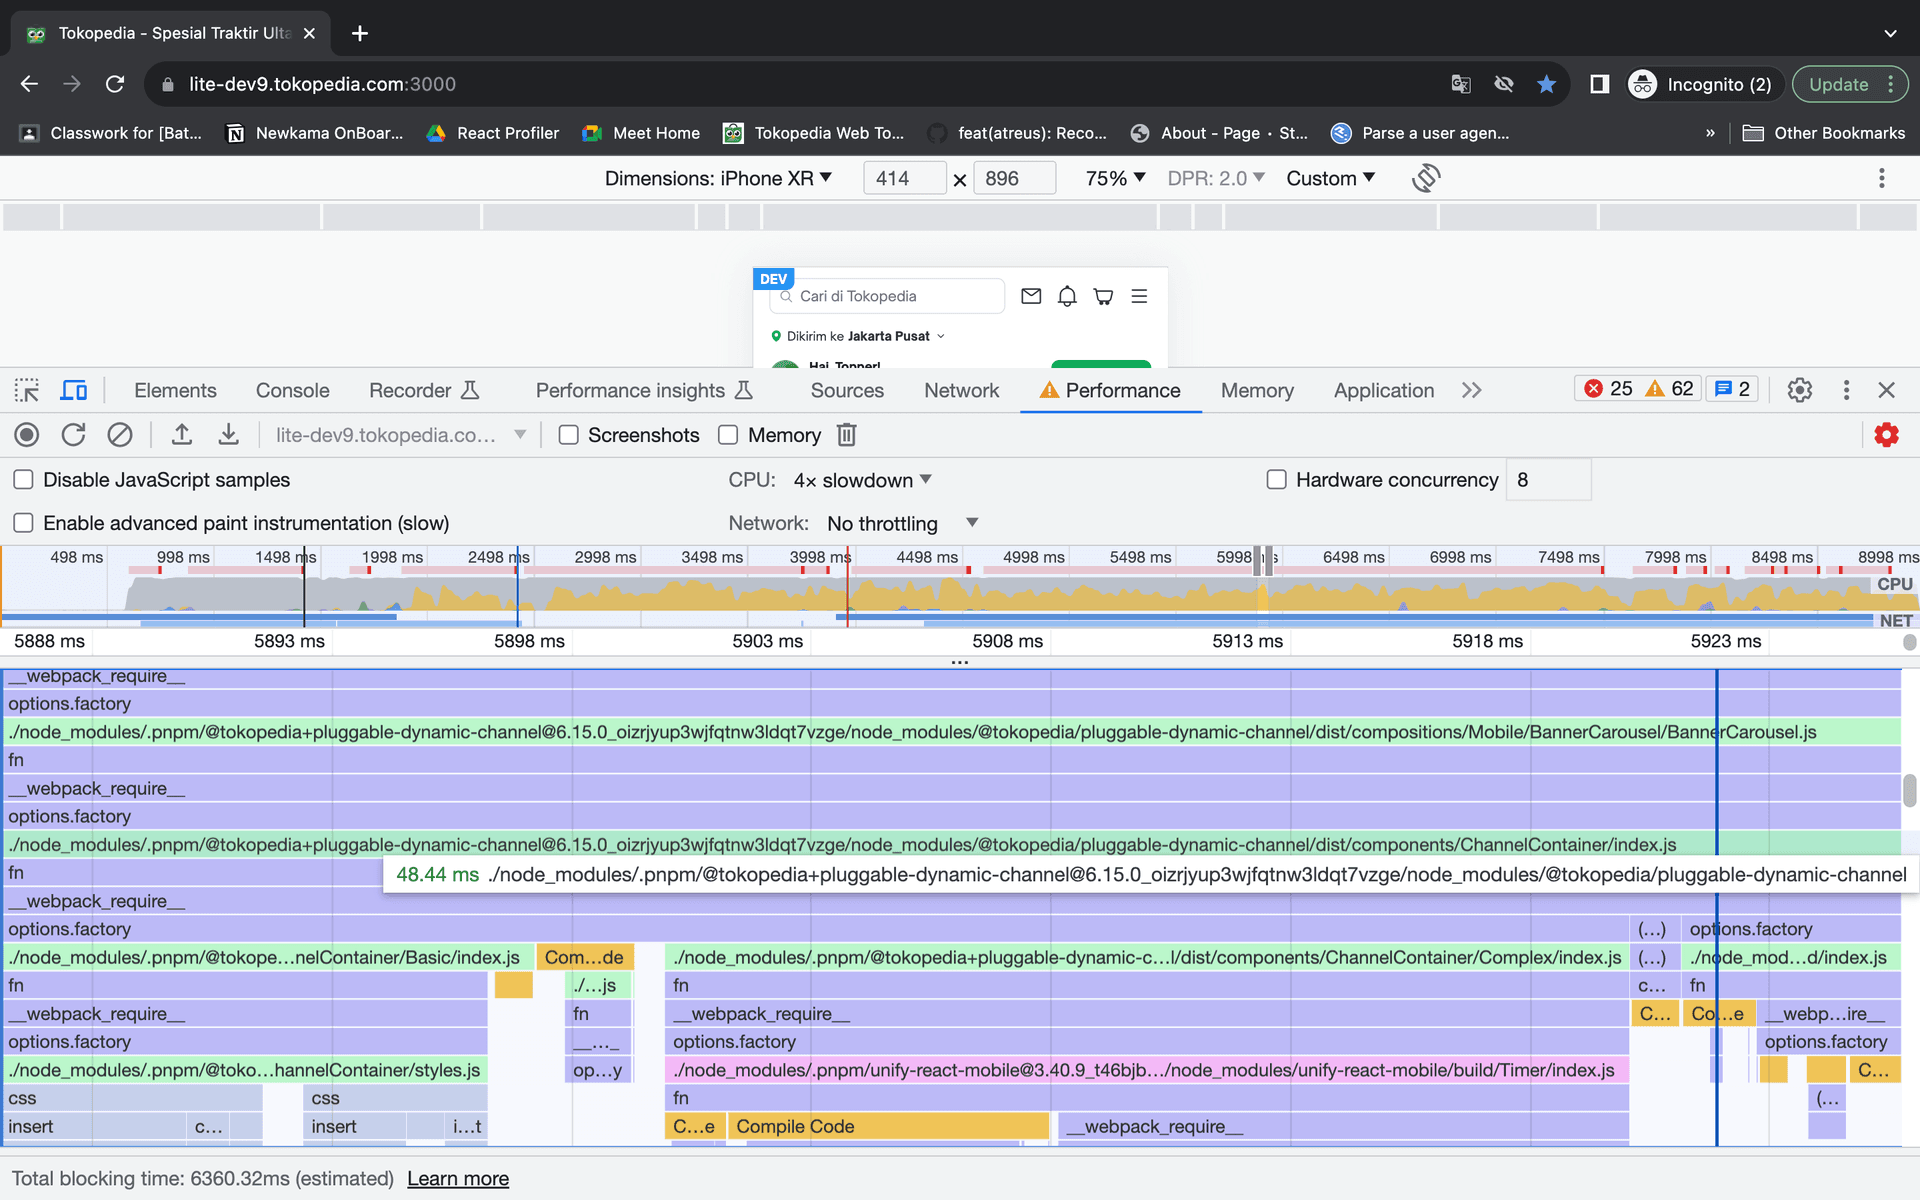
Finding: 6 layout variants from A/B tests were included but unused
- •Used bloated ChannelContainer with 6 A/B test layout variants
- •All variants bundled despite only 1 ever active at a time
- •Entire @tokopedia/lite-hooks imported for single useIntersect hook
Solution
// BEFORE: Bloated dependency
import BannerCarousel from
  '@tokopedia/pluggable-dynamic-channel';
// Bundles: 6 layouts, all dependencies

// AFTER: Direct hook import + simple div
import useIntersect from
  '@tokopedia/lite-hooks/dist/useIntersect';

const BannerCarousel = ({ children }) => (
  <div className="banner-container">
    {children}
  </div>
);- •Direct hook import enables tree-shaking — unused hooks excluded
- •Simple div replaces complex ChannelContainer component
- •6 unused layout variants removed from bundle entirely
- •Reduced complexity without changing visual appearance
Output
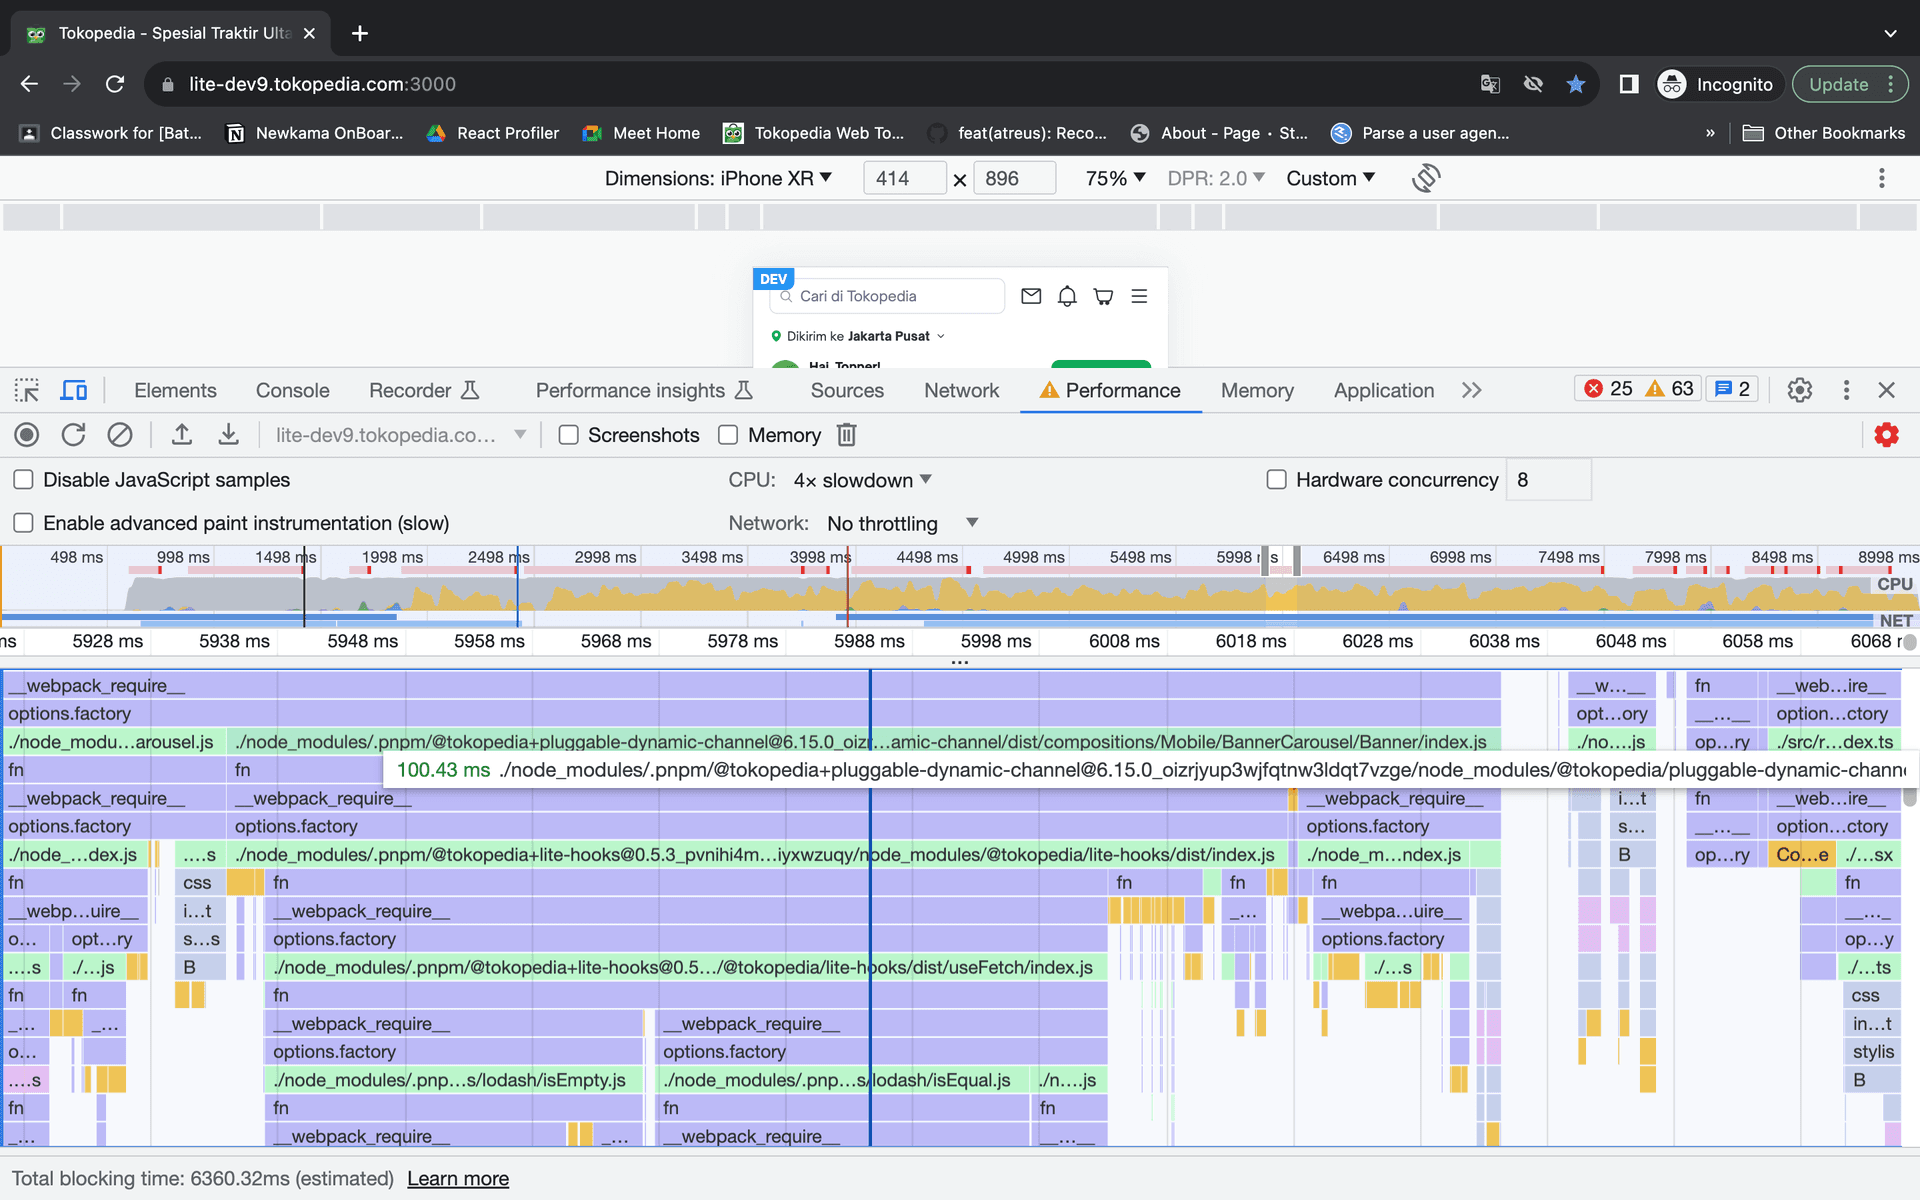
Issue: Entire @tokopedia/lite-hooks library bundled despite only using useIntersect
| Metric | Before | After | Improvement |
|---|---|---|---|
| Dependencies | Full library | Single hook | Tree-shaken |
| Layout Variants | 6 (unused) | 1 (used) | 83% reduction |
Channel Pagination
33 channels at once (~900KB) → 10 channels (~280KB)
Problem

Before: Single response included all 33 channels (~900KB)
- •All 33 channels fetched in single GraphQL request
- •Response size: ~900KB of which most users only see first 10
- •Data showed most users never scrolled past initial channels
Solution
// BEFORE: All channels at once
const { data } = useQuery(
  GetAllChannelsQuery,
  { variables: { limit: 33 } }
);

// AFTER: Paginated with IndexedDB cache
const useChannels = (page = 1) =>
  useQuery(GetChannelsQuery, {
    variables: { page, limit: 10 },
    context: {
      idb: {
        enabled: true,  // ← From Case 00 (Apollo IDB)
        ttl: 30,
      },
    },
});- •Pagination reduces initial payload from 33 to 10 channels
- •IndexedDB cache prevents refetching on subsequent visits
- •Subsequent pages load on scroll when needed
- •70% reduction in initial data transfer
Output

After: Paginated responses reduced initial payload by ~70%
| Metric | Before | After | Improvement |
|---|---|---|---|
| Initial Payload | ~900KB | ~280KB | ~70% reduction |
| Channels Loaded | 33 | 10 | Paginated |
Sequential Rendering
CLS 0.12 (layout shifts) → CLS 0.00 (stable)
Problem

Issue: All components mounted at initial load, including offscreen components
- •All components mounted at initial load including offscreen content
- •Fast scrolling caused sudden height changes as components rendered
- •Feed and SEO sections expanded unpredictably, causing layout shifts
- •CLS score: 0.12 (poor user experience)
Solution
// Checkpoint system with useSyncExternalStore
const useCheckpoint = (checkpoint) => {
  const snapshot = useSyncExternalStore(
    checkpointStore.subscribe,
    () => checkpointStore.getSnapshot(checkpoint),
    () => false  // SSR: always false
  );

  const setCheckpoint = (name) => {
    postTask(() => checkpointStore.setStore(name), {
      priority: 'background'  // Non-urgent
    });
  };

  return [snapshot, setCheckpoint];
};

// Phase 1: Mount above-the-fold, mark checkpoint
const Phase1 = () => {
  const [, reach] = useCheckpoint();
  useEffect(() => reach('dc'), []);
  return <DynamicChannel limit={3} />;
};

// Phase 2: Wait for 'dc' checkpoint before mounting
const Phase2 = () => {
  const [ready] = useCheckpoint('dc');
  return ready ? <FullPagination />
    : <Placeholder height={400} />;
};- •useSyncExternalStore provides SSR-safe external state management
- •postTask with background priority defers non-urgent updates
- •Checkpoints coordinate mounting sequence across components
- •Fixed-height placeholders prevent layout shifts during loading
Output
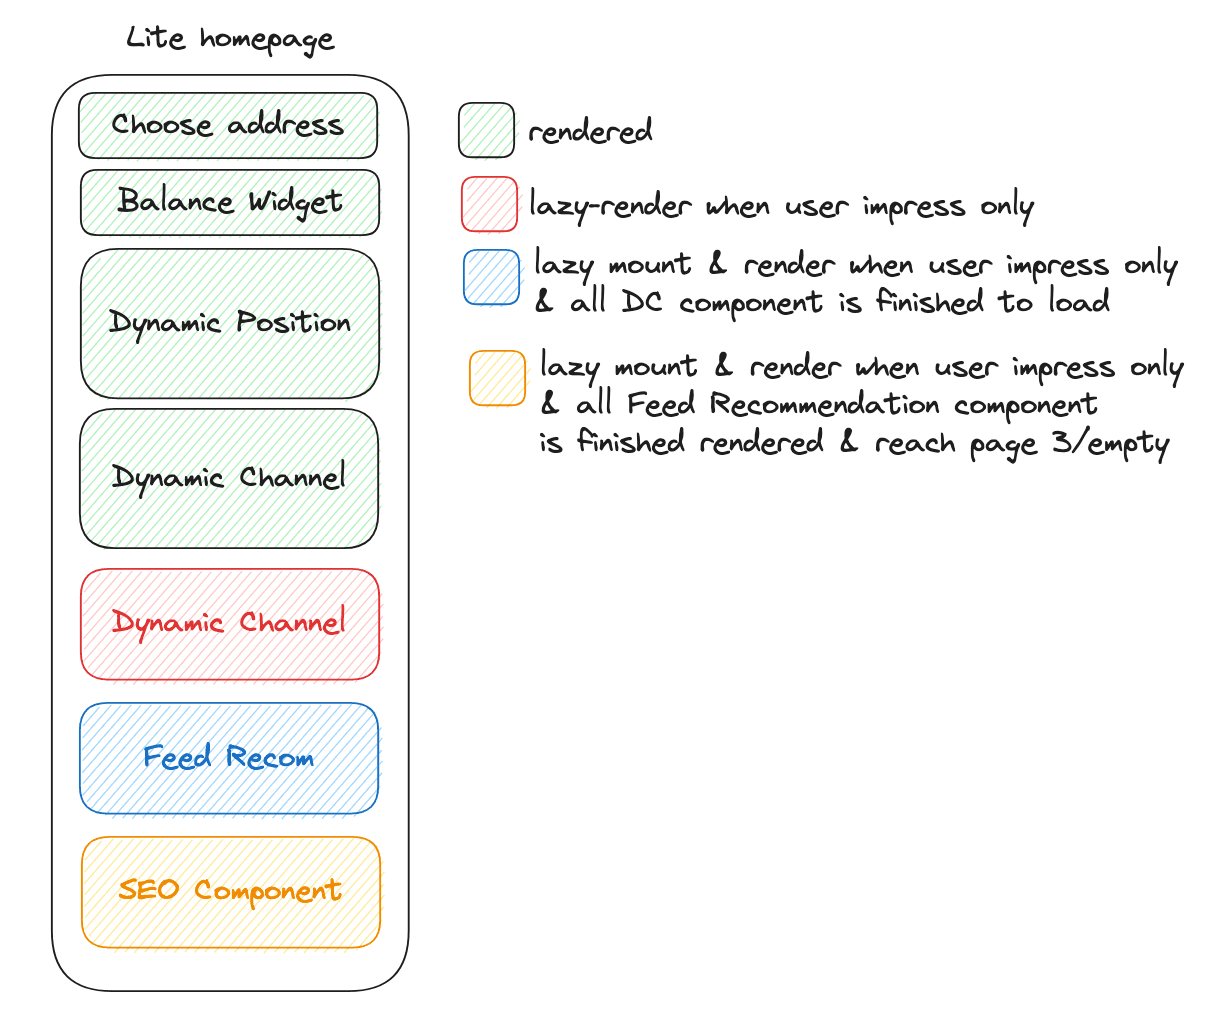
Implementation: Progressive loading based on viewport visibility and scroll position
| Metric | Before | After | Improvement |
|---|---|---|---|
| CLS Score | 11.86s | 10.82s | 8.77% improvement |
| Layout Shifts | Multiple | None | 100% eliminated |
Overall Impact
Six targeted optimizations delivered measurable improvements across all key performance metrics.
Complete Metrics
| Metric | Before | After | Improvement |
|---|---|---|---|
| Total Transfer Size | 10.5 MB | 7.2 MB | 31.4% reduction |
| DOMContentLoaded | 1.55s | 987ms | 36.3% faster |
| Total Load Time | 2.71s | 2.31s | 14.8% faster |
| Hydration Time | 1.39s | 885ms | 36.1% reduction |
| Left Carousel Chunk Size | 3.8 MB | 619 kB | 83.7% reduction |
| Home Chunk Size | 3.7 MB | 2.3 MB | 37.8% reduction |
| Left Carousel Task Time | 169.13ms | 64.19ms | 62.0% reduction |
| Performance Score | 48 | 51 | 6.25% improvement |
| First Contentful Paint (FCP) | 2.92s | 2.74s | 6.16% improvement |
| Largest Contentful Paint (LCP) | 3.35s | 3.15s | 5.97% improvement |
| Total Blocking Time (TBT) | 3.06s | 2.27s | 25.82% improvement |
| Time to Interactive (TTI) | 11.86s | 10.82s | 8.77% improvement |
| Cumulative Layout Shift (CLS) | 0.12 | 0.00 | 100% reduction (Sequential Rendering) |
| First Input Delay (FID) | ~90ms | ~70ms | ~22% improvement |
Qualitative Improvements
Significantly faster perceived load time for returning users on mobile devices
Reduced data usage benefits users on limited bandwidth plans
Smoother initial page interaction due to reduced hydration overhead
Improved Lighthouse scores positively impact SEO rankings
Cleaner component architecture enables future optimizations
Backend load reduced due to paginated channel requests
Eliminated layout shifts during fast scrolling with Sequential Rendering
Better scroll performance with progressive component mounting
Above-the-fold content prioritization improves perceived performance
Reduced memory pressure by deferring offscreen component initialization